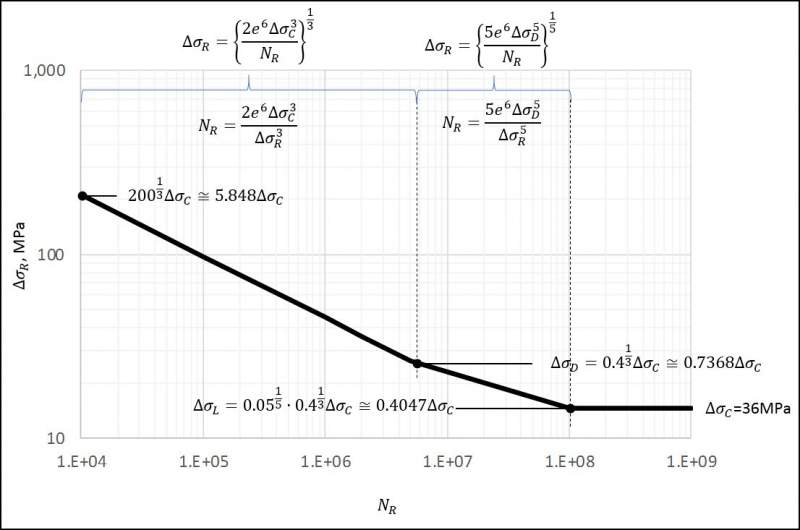
EC9 - Fatigue Curves
Introduction
The fatigue data in EC9 is presented in a manner aimed at simplifying the engineer’s task in assessing the structural integrity of his/her design. The engineer used to conventional fatigue assessment needs to put all that knowledge on Goodman diagrams, mean stress corrections, etc., to the background when using EC3. All he/she needs to do is to identify the detail category from the table provided to identify the correct SN curve in figure 7.1 of EC9 and out pops the design stress required to avoid fatigue failure or to offer a given service life.

